Debugging Techniques for JavaScript Developers: Finding and Fixing Bugs Efficiently 🔍🛠️
Top Methods to Debug JavaScript and Solve Issues Fast
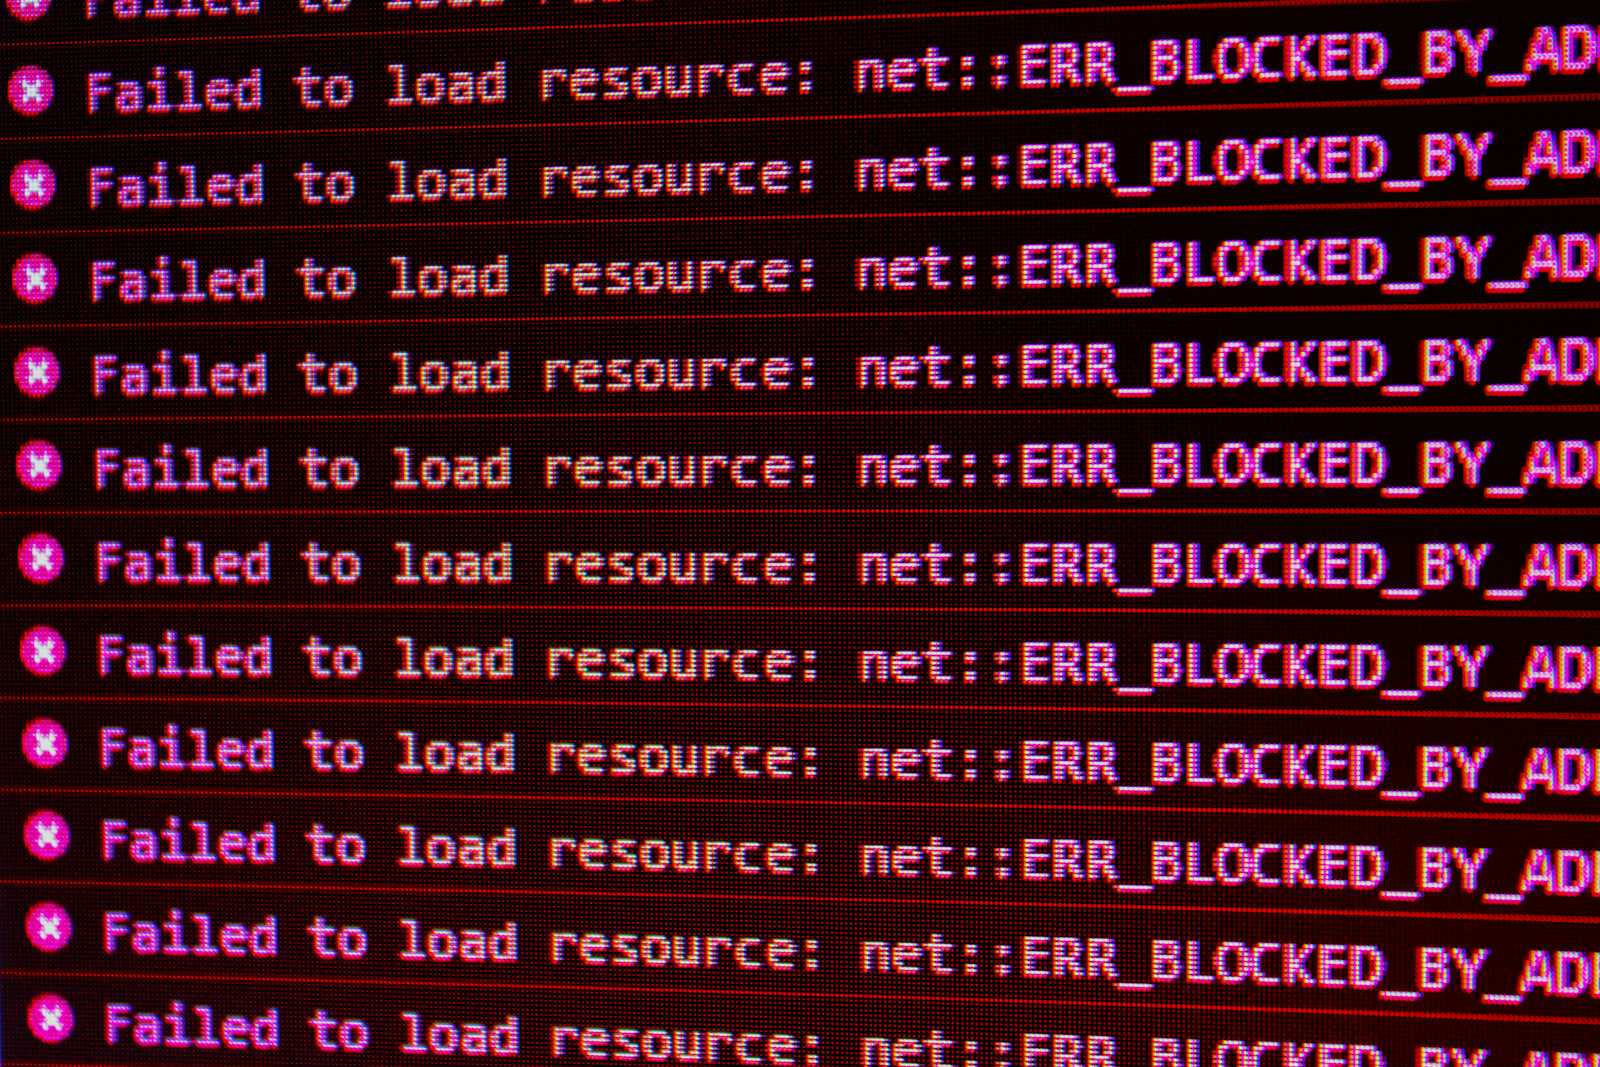
As a JavaScript developer, you've likely encountered bugs that have made you pull your hair out. 🥴 Bugs are inevitable, but with the right techniques, you can find and fix them efficiently, saving time and frustration. This guide covers some of the best debugging techniques to help you become a more effective JavaScript developer. 🚀
1. Understanding the Problem 🤔
Before diving into debugging, it's essential to understand the problem. Here are a few steps to help you get a clear picture of the issue:
Reproduce the Bug: Try to consistently reproduce the bug. Understanding how and when it occurs can provide valuable insights into its cause.
Read the Error Messages: Pay attention to the error messages and stack traces. They often provide clues about where the problem lies.
Check the Console: Use the browser's console to look for errors or warnings that might not be immediately visible.
2. Utilizing Browser Developer Tools 🛠️
Modern browsers come with powerful developer tools that can help you debug JavaScript code efficiently.
Chrome DevTools 🔧
Breakpoints: Use breakpoints to pause execution and inspect variables at specific points in your code.
function calculateSum(a, b) {
  debugger; // This acts as a breakpoint
  return a + b;
}

const result = calculateSum(5, 10);
console.log(result);
Watch Expressions: Monitor specific variables or expressions over time to see how their values change.
Call Stack: View the call stack to understand the order of function calls leading to an error.
Network Panel: Inspect network requests to check if data is being sent or received as expected.
Visual Studio Code Debugger 🖥️
Integrated Debugging: VSCode offers built-in debugging tools for JavaScript. Set breakpoints, step through code, and watch variables directly in your editor.
{
  "version": "0.2.0",
  "configurations": [
    {
      "type": "node",
      "request": "launch",
      "name": "Launch Program",
      "program": "${workspaceFolder}/app.js"
    }
  ]
}
3. Logging and Console Techniques 📝
Sometimes, the simplest approach is the most effective. Logging can help you track down issues by printing information to the console.
console.log(): Print variable values and check program flow.
const user = { name: 'Alice', age: 30 }; console.log('User:', user);console.error(): Highlight errors or exceptions in a different color for better visibility.
if (!user) { console.error('User not found!'); }console.table(): Display tabular data in a more readable format.
  const users = [
    { name: 'Alice', age: 30 },
    { name: 'Bob', age: 25 }
  ];
  console.table(users);
4. Debugging Asynchronous Code ⏳
JavaScript's asynchronous nature can make debugging a challenge. Here are some techniques to help:
Promises and Async/Await: Use async/await to write cleaner asynchronous code that's easier to debug.
  async function fetchData() {
    try {
      const response = await fetch('https://api.example.com/data');
      const data = await response.json();
      console.log(data);
    } catch (error) {
      console.error('Fetch error:', error);
    }
  }

  fetchData();
Promise Chains: Use
.catch()at the end of promise chains to handle errors.fetch('https://api.example.com/data') .then(response => response.json()) .then(data => console.log(data)) .catch(error => console.error('Error:', error));Async Callbacks: Use callbacks to handle async operations and errors.
  function fetchData(callback) {
    setTimeout(() => {
      try {
        const data = { key: 'value' };
        callback(null, data);
      } catch (error) {
        callback(error);
      }
    }, 1000);
  }

  fetchData((error, data) => {
    if (error) {
      console.error('Error:', error);
    } else {
      console.log('Data:', data);
    }
  });
5. Using Linting and Static Analysis 🧐
Linting tools can catch potential bugs before they even run.
ESLint 🧹
Static Code Analysis: Identify syntax errors, potential bugs, and enforce coding standards.
# Install ESLint globally
npm install -g eslint

# Initialize ESLint in your project
eslint --init
Configuration: Customize ESLint rules to fit your project's needs.
{
  "rules": {
    "eqeqeq": "error",
    "no-console": "warn",
    "curly": "error"
  }
}
6. Writing Unit Tests 🧪
Unit tests can help catch bugs early by testing individual components of your application.
Jest Testing Framework ⚗️
Write Tests: Define test cases for different parts of your codebase.
// sum.js
function sum(a, b) {
  return a + b;
}
module.exports = sum;

// sum.test.js
const sum = require('./sum');

test('adds 1 + 2 to equal 3', () => {
  expect(sum(1, 2)).toBe(3);
});
Run Tests: Execute tests to verify code correctness.
npm test
7. Peer Code Reviews 👫
Collaborate with team members to review each other's code. Fresh eyes can often spot issues you might have missed. Feedback can lead to improved code quality and better practices.
8. Documenting Bugs and Solutions 📚
Maintain a bug journal or use tools like Jira to document bugs and solutions. Keeping a record can help identify patterns and improve your debugging skills over time.
Debugging is an essential skill for any developer, and mastering these techniques will make you more efficient and effective in finding and fixing bugs. By leveraging browser tools, logging, testing, and collaboration, you can tackle even the toughest bugs with confidence.
Remember, the goal is to understand the problem, find a solution, and prevent it from happening again. With practice and persistence, you'll become a debugging pro! 🚀
Happy debugging! 🎉
Feel free to share your own debugging tips and experiences in the comments below! 💬


